The agriculture sector is large, diversified, and heavily integrated with the United States, making it a best prospect industry sector for U.S. companies in Mexico.
Overview
Mexico is the United States’ second-largest agricultural export market. In 2022, U.S. agricultural and related product exports to Mexico reached USD 28.4 billion. U.S.-origin products accounted for about 70 percent of Mexico´s total food and agricultural food and agricultural imports in 2022. Conversely, the United States remained Mexico’s principal agricultural export market, receiving over USD 43.4 billion of Mexico’s total agricultural exports in 2022. U.S. market share in Mexico remains robust due to geographical advantages, deeply interlinked supply chains, and trade benefits under the United States-Mexico-Canada Agreement (USMCA).
In recent years, competition has emerged from producers in the European Union, South America, and Asia. Additionally, since he was inaugurated in 2018, President López Obrador’s Administration has prioritized domestic production and programs to promote and incentivize small-scale production and local consumption, with a goal to become self-sufficient in core agricultural products, such as corn and dairy products.
In May 2022, the Government of Mexico (GOM) announced a program to combat food price inflation and scarcity titled Paquete Contra la Inflacion y la Carestia (PACIC). On January 6, 2023, the GOM expanded the suspension of import tariffs to include products such as fresh and frozen turkey, animal feed inputs, and agricultural inputs. Along with PACIC, President López Obrador announced a plan to maintain “fair prices” for the basic food basket through a voluntary agreement with the private sector, without the use of mandatory price controls. The PACIC plan calls for a suspension until December 2023 of import tariffs on 21 staple items and five basic commodities for food processing. The program also includes steps to support increased production of grains by subsistence farmers, including bolstering fertilizer production for use by small producers. Also, under PACIC, the enforcement date of the Carta Porte tax on transport of goods within Mexico will be delayed until December of 2023 (see the Customs, Regulations, & Standards section of this guide for information on Carta Porte).
Leading Sub-Sectors
The top U.S. agricultural exports to Mexico include corn, soybeans, dairy products, pork, wheat, poultry meat (excluding eggs), beef, soybean meal, and food preparations. It is the second or third-largest market for key product groups such as corn, soybeans, soybean meal, and foods preparations.
Graph: Top U.S. Agricultural Exports in Value to Mexico by Commodity
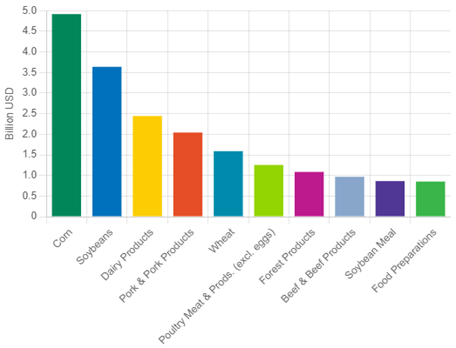
Source: USDA Foreign Agricultural Service (FAS) Global Agricultural Trade System
Table below shows summaries of a few of notable agricultural market subsectors in Mexico. Additional information on each of these topics (as well as other agricultural sectors) is available on the U.S. Department of Agriculture’s (USDA) Global Agricultural Information Network (GAIN).
Major Agricultural Exports from the United States to Mexico
(Values in USD Millions)
Table 1:
|
Product |
Calendar Years |
January-May Comparisons |
|||||||||
|
2018 |
2019 |
2020 |
2021 |
2022 |
2022 |
2023 |
% Change |
||||
|
FAS Agricultural Total |
19,303 |
19,399 |
18,343 |
25,449 |
28,451 |
11,324 |
11,884 |
5 |
|||
|
Grains & Feeds |
5,471 |
5,497 |
5,305 |
8,254 |
8,918 |
3,765 |
4,124 |
10 |
|||
|
Corn |
3,061 |
2,736 |
2,685 |
4,699 |
4,923 |
2,116 |
2,544 |
20 |
|||
|
Wheat |
662 |
812 |
778 |
1,293 |
1,585 |
674 |
536 |
-20 |
|||
|
Rice |
270 |
280 |
247 |
308 |
220 |
130 |
90 |
-31 |
|||
|
Barley Products |
210 |
211 |
183 |
243 |
196 |
80 |
108 |
34 |
|||
|
Wheat Flour |
84 |
92 |
100 |
96 |
100 |
45 |
27 |
-40 |
|||
|
Oilseeds & Products |
3,247 |
3,239 |
3,249 |
4,338 |
5,484 |
2,129 |
2,005 |
-6 |
|||
|
Soybeans |
1,818 |
1,878 |
1,880 |
2,622 |
3,642 |
1,355 |
1,264 |
-7 |
|||
|
Other Oilseed Prod. |
193 |
204 |
204 |
277 |
336 |
136 |
129 |
-5 |
|||
|
Peanuts |
132 |
134 |
125 |
160 |
175 |
74 |
79 |
7 |
|||
|
Soybean Oil |
129 |
113 |
98 |
89 |
117 |
77 |
30 |
-61 |
|||
|
Other Oils |
43 |
24 |
28 |
27 |
39 |
15 |
19 |
23 |
|||
|
Sunflower seed |
9 |
7 |
5 |
12 |
12 |
4 |
4 |
-7 |
|||
|
Horticultural Products |
3,101 |
3,056 |
2,992 |
3,790 |
3,975 |
1,496 |
1,573 |
5 |
|||
|
Other Hort Products |
1,265 |
1,183 |
1,113 |
1,396 |
1,524 |
582 |
643 |
10 |
|||
|
Vegetables and Preparations |
676 |
735 |
801 |
1,057 |
1,089 |
399 |
470 |
18 |
|||
|
Fruits and Preparations |
790 |
797 |
751 |
1,004 |
966 |
330 |
326 |
-1 |
|||
|
Tree Nuts and Preparations |
370 |
341 |
327 |
333 |
395 |
185 |
134 |
-28 |
|||
|
Livestock & Meats |
3,117 |
3,086 |
2,662 |
3,833 |
3,984 |
1,538 |
1,695 |
10 |
|||
|
Pork, Fr/Ch/Fz |
1,006 |
967 |
914 |
1,346 |
1,701 |
587 |
737 |
25 |
|||
|
Beef & Veal, Fr/Ch/Fz |
824 |
821 |
619 |
788 |
697 |
291 |
337 |
16 |
|||
|
Variety Meats, Beef |
230 |
277 |
228 |
264 |
266 |
100 |
120 |
20 |
|||
|
Variety Meats, Pork |
152 |
149 |
123 |
173 |
168 |
66 |
86 |
31 |
|||
|
Dairy & Products |
1,375 |
1,526 |
1,401 |
1,786 |
2,443 |
916 |
1,024 |
12 |
|||
|
Non-Fat Dry Milk |
658 |
779 |
708 |
961 |
1,325 |
486 |
554 |
14 |
|||
|
Cheese and Curd |
387 |
419 |
428 |
457 |
628 |
233 |
288 |
23 |
|||
|
Whey |
92 |
112 |
79 |
124 |
174 |
66 |
63 |
-6 |
|||
|
Fluid Milk and Cream |
26 |
23 |
19 |
18 |
21 |
9 |
8 |
-4 |
|||
|
Butter And Milkfat |
33 |
12 |
11 |
12 |
29 |
11 |
6 |
-48 |
|||
|
Dry Whole Milk & Cream |
18 |
11 |
8 |
17 |
21 |
11 |
5 |
-56 |
|||
|
Poultry & Products |
1,143 |
1,280 |
1,197 |
1,567 |
1,478 |
598 |
602 |
1 |
|||
|
Broiler Meat |
517 |
605 |
574 |
833 |
765 |
310 |
322 |
4 |
|||
|
Turkey Meat |
389 |
427 |
379 |
450 |
457 |
188 |
164 |
-13 |
|||
|
Egg and Egg Products |
166 |
181 |
192 |
215 |
194 |
74 |
87 |
18 |
|||
|
Other Poultry Meat |
50 |
45 |
30 |
44 |
32 |
17 |
14 |
-18 |
|||
|
Sugar & Tropical Products |
1,080 |
1,056 |
942 |
1,056 |
1,176 |
461 |
525 |
14 |
|||
|
Sugar & Rel Pdt,X Hon |
725 |
676 |
609 |
598 |
717 |
276 |
343 |
19 |
|||
|
Cocoa & Cocoa Prod. |
218 |
221 |
180 |
250 |
244 |
94 |
104 |
11 |
|||
|
Sugar & Trop, Misc. |
45 |
49 |
63 |
98 |
81 |
37 |
30 |
-19 |
|||
|
Coffee & Coffee Prod |
34 |
42 |
36 |
41 |
62 |
24 |
21 |
-11 |
|||
|
Tea, Incl Herbal Tea |
26 |
39 |
32 |
40 |
47 |
20 |
18 |
-9 |
|||
|
Planting Seeds |
245 |
227 |
214 |
223 |
244 |
96 |
114 |
19 |
|||
|
Cotton, Linters & Waste |
374 |
291 |
181 |
412 |
537 |
227 |
115 |
-49 |
|||
|
Ethanol (non-bev.) |
1,080 |
1,056 |
942 |
1,056 |
1,176 |
461 |
525 |
14 |
|||
Note: Not all sub-categories of products are listed here. Go to data source to see full table
Data Source: GATS Report
Table 2: Mexico Corn Market Overview
(Figures in Thousands of Metric Tons)
|
Indicator |
2021 |
2022 |
2023 (Est.) |
|
Total Local Production |
26,762 |
26,500 |
27,400 |
|
Total Domestic Consumption |
44,000 |
44,000 |
45,700 |
|
Total U.S. Exports to Mexico |
16,840 |
15,435 |
- |
|
Total U.S. Imports from Mexico |
23 |
26 |
- |
Source: Foreign Agricultural Service’s Production, Supply and Distribution (PSD) Global Agricultural Trade System (GATS) (Production and Consumption Data listed in Marketing Year)
In 2022, Mexico was the third-largest export market for corn, with exports valued at USD 4.92 billion. Mexico relies on corn imports for almost 40 percent of total consumption. Corn imports are used to supplement domestic production of cereals, starches, tortillas, and other processed products, as well as to support the animal feed industry. Additionally, a variety of corn-based products are also exported to Mexico. Robust and stable corn demand for animal feed and industrial uses supports continued imports to supplement domestic production. Growth in feed use in general, and from the poultry sector in particular, is the primary driver of growth in Mexico’s corn imports. (See Mexico: 2023 Grain and Feed Annual for additional details)
Table 3: Mexico Wheat Market Overview
(Figures in Thousands of Metric Tons)
|
Indicator |
2021 |
2022 |
2023 (Est.) |
|
Total Local Production |
3,281 |
3,572 |
3,300 |
|
Total Domestic Consumption |
7,425 |
7,900 |
7,900 |
|
Total U.S. Exports to Mexico |
4,152 |
3,933 |
- |
|
Total U.S. Imports from Mexico |
37 |
37 |
- |
Source: Foreign Agricultural Service’s PSD, GATS (Production and Consumption Data listed in Marketing Year)
Mexico is the top export market for U.S. wheat, with 2022 exports valued at USD 1.59 billion. The United States is Mexico’s leading wheat supplier, followed by Canada. Mexico’s milling demand continues to grow. In addition, U.S. wheat is competitively priced and accessible through both rail and maritime supply chains. (See Mexico: 2023 Grain and Feed Annual for additional details)
Table 4: Mexico Soybean Market Overview
(Figures in Thousands of Metric Tons)
|
Indicator |
2021 |
2022 |
2023 (Est.) |
|
Total Local Production |
288 |
175 |
235 |
|
Total Domestic Consumption |
6,402 |
6,552 |
6,555 |
|
Total U.S. Exports to Mexico |
3,742 |
5,200 |
- |
|
Total U.S. Imports from Mexico |
0 |
0 |
- |
Source: Foreign Agricultural Service: PSD, GATS (Production and Consumption Data listed in Marketing Year)The United States continues to serve as the main exporter and supplier of soybean and related products to Mexico. Growth in Mexico’s livestock sector has driven growth in demand for U.S. soybeans and soybean meal in recent years. Mexico is the second-largest export market for U.S. soybeans and soybean meal with a combined value of USD 4.5 billion. Soybeans are generally imported and crushed in Mexico for use as edible oil for human consumption and soy meal for livestock feed. Mexican oilseed crushers are expected to continue increasing oil production to keep up with population growth and meal demand. (See Mexico: 2023 Oilseeds and Products Annual)
Mexico Dairy Products Overview
Mexico is largest export market for U.S. dairy products, valued at USD 2.44 billion in 2022. Although domestic Mexican production is growing, it will continue to be an attractive market for U.S. dairy and dairy product exporters. The dairy processing industry competes for inputs and uses dairy imports to close the gap between demand and production. For example, about 97 percent of the skim milk powder consumed in Mexico is imported from the United States. (See Mexico: 2022 Dairy and Products Annual)
Mexico Poultry and Egg Market Overview
Mexico is the number one export market for U.S. poultry products (excluding eggs), valued at USD 1.26 billion in 2022. Chicken meat is the preferred animal protein for domestic consumption due to its lower price and versatility in Mexican cuisine. Additionally, Mexico is the number one consumer of eggs in the world. Most poultry and egg imports continue to originate in the United States, while exports by Mexico are limited. (See Mexico: 2022 Poultry and Products Annual)
Processing Ingredients Market Overview
Mexico continues to be a growth market for U.S. processing ingredients with a strong processing sector demanding an array of inputs. Despite the economic turmoil caused by the COVID-19 pandemic, the food processing industry in Mexico remains stable with low growth, as it is large and well established. According to the Mexican Association of Nationwide Retailers (ANTAD), there are 25 supermarket chains with a combined 3,333 stores (data do not include Walmart Mexico as it is no longer part of ANTAD). Additionally, there are 2,524 department stores and 41,405 specialized stores throughout Mexico. More than 57 percent of the retail market is covered by informal establishments (mobile street vendors and open public markets) which traditionally distribute local products. This remained the case despite the pandemic and associated lockdowns. ANTAD also reported that supermarket sales grew steadily by approximately 13 percent in 2022.
The sector is diversifying to provide tailored products for consumers, moving away from one highly-branded product lines to multiple lines and niche products. Some food ingredients with strong sales potential include (but are not limited to) vegetable proteins, non-wheat flours, extracts and functional products, plant-based ingredients, products with added elements such as vitamins and probiotics, and some dairy products. For more information on this sector, please refer to FAS’ Food Processing Ingredients Report, which is updated yearly.
Mexico Fresh Fruit Market Overview
The United States is the largest supplier of apples, pears, and grapes to the Mexican market, and this trend is expected to continue. Increased demand from the resurgence of Mexico’s hospitality and food service sectors post-pandemic is mitigated by continued pressure on household budgets due to high food prices. As Mexico is a price sensitive market, fruit import levels depend heavily on U.S. product prices, exchange rates, and the availability of lower cost fruits. The wholesale channel is the most important channel for the distribution of U.S. and Mexican fresh fruits. Mexico is the largest export market for U.S. apples by some distance. Chile is also a regular supplier to Mexico, but only in small volumes in comparison to U.S.-Mexico trade. Large scale producers in Chihuahua and Coahuila are also increasing high technology-controlled atmosphere and refrigerated storage capacity to preserve and offer quality apples year-round much like the United States. U.S. pear export growth is limited due to high import prices and high inflation in Mexico.
Mexico is the second-largest market for U.S. table grapes after Canada. Limited demand growth is attributed to generally abundant domestic production, high inflation, and increased prices at point-of-sale. Middle and low-income consumers consider grapes as a high-end product, particularly when imported from the United States, as well as from Chile and Peru. The volume of Mexican grapes on the local market depends on export volumes, as producers tend to supply the international market before the domestic market.
Opportunities
The FAS office in Mexico is ready to assist you in exploring market opportunities. Because Mexico is a large and diverse market for U.S. agricultural products, FAS is developing a series of ‘Market Snapshot’ reports about important regional markets. Examples include Guadalajara, Los Cabos and others on the Global Agricultural Information Network (GAIN). Before the COVID-19 pandemic, consumer demand for food products perceived as ‘healthful’, including organic products, alternative ingredients, functional foods, and other niche food products saw year-on-year sales growth in Mexico. As diseases such as obesity, hypertension, and diabetes are common in Mexico, a growing number of Mexican consumers are changing their eating habits in favor of products they perceive as healthful, making Mexico an attractive market for U.S. exports of ‘healthful’ food products. Mexican food and beverage labeling regulations also attempt to discourage consumption of highly-caloric products, as well as and products containing high levels of sodium, sugar, and trans fats. As a result, some manufacturers have reformulated and/or resized (or are in the process of reformulating and resizing) some product lines.
Mexico’s young population is highly influenced by social media and is aware of global food trends. Modern retail in Mexico is changing rapidly mainly because of the increased use of eCommerce platforms and delivery apps. For further information about best prospects for foods in Mexico and a quick guide on how to export to Mexico, please see USDA’s country Exporter Guide. For additional information about specific market entry sectors, see the Retail Foods, Food Processing Ingredients, or Food Service-Hotel Restaurant Institutional reports.
|
USDA |
|
|
USDA GATS |
|
|
USDA FAS PSD |
|
|
USDA GAIN |
|
Events
ABASTUR (Restaurant and Hospitality), August 30-September 1, 2023. Mexico City
Food Tech Summit (Food Processing Ingredients), September 27-28, 2023. Mexico City
Cerveza Mexico (Craft Beer), October 20-22, 2023. Mexico City
ANTAD and Alimentaria (Retail, Food, and Beverage), March 12-14, 2024. Guadalajara, Jalisco
Contacts
For more information on agricultural sectors in Mexico, please visit our website or contact USDA’s Mexico offices:
Agricultural Trade Office —Mexico City
Tel.: + 52 55 5080 2000 ext. 5282
Agricultural Trade Office —Monterrey
Tel.: + 52 81 8047 3232
Office of Agricultural Affairs —Mexico City
Tel.: + 52 55 5080 2532