Air transport services are essential to the United States’ global connectivity, enabling the rapid and reliable movement of passengers and goods. The air transport services industry encompasses a range of activities, which include passenger and cargo operations, airport and ground handling operations, air navigation services, and other logistics services. These services work together to ensure the safe and secure transportation of people and goods.
The air transport industry plays a critical role in the U.S. economy. Air transport services facilitate international trade, support tourism, create high-value jobs, and increase access to global markets with commercial aviation driving nearly 5% of U.S. GDP. As a cornerstone of global infrastructure, air transport services strengthen supply chains and improve regional connectivity. The United States is the largest global freight market and largest domestic air passenger market in the world.
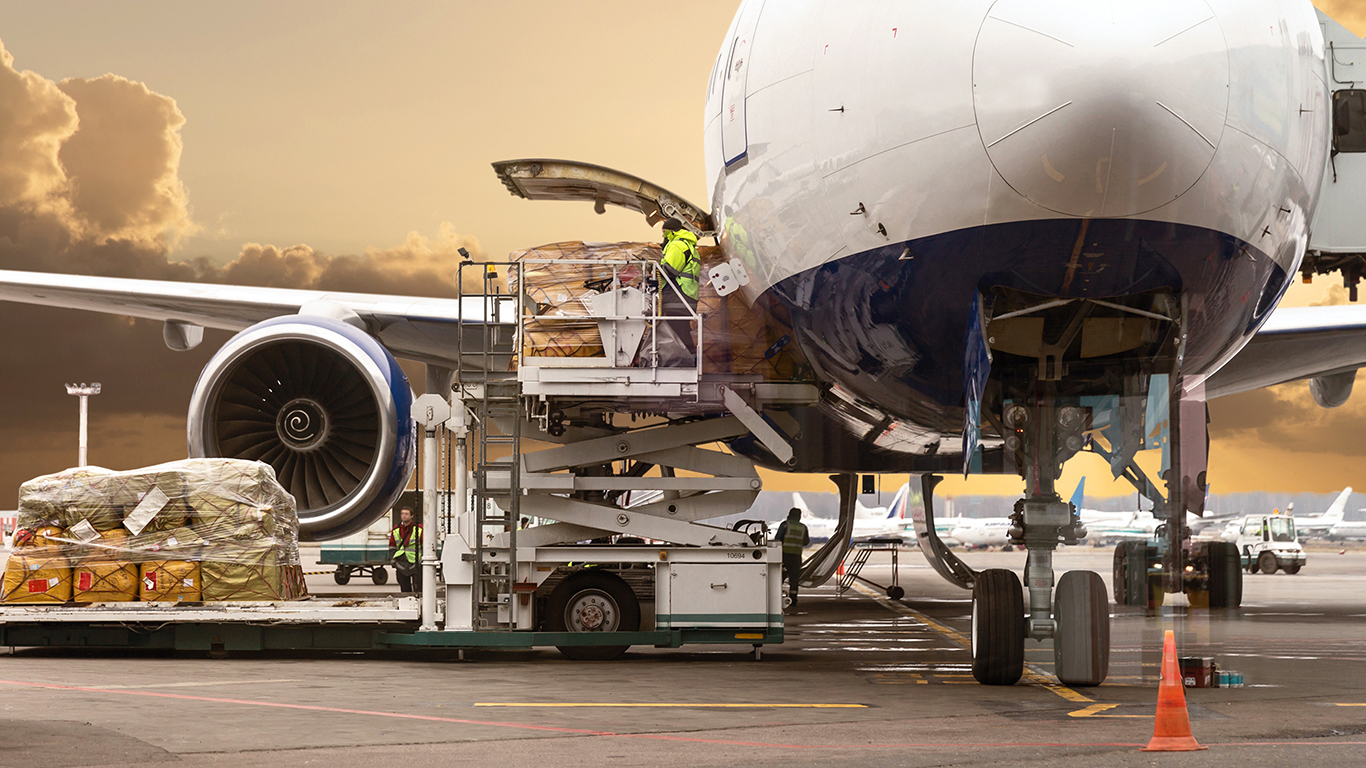
Air cargo, moving on dedicated freighters and in the holds of passenger aircraft, represents more than one-third of global trade by value, despite comprising less than 2% by volume, and is relied on to efficiently transport small but high-value goods, perishable goods, time-sensitive shipments like medical supplies, industrial components, e-commerce packages, and humanitarian aid.
The air transport sector faces a range of challenges and trends shaping the development of the industry and its role in global transportation and trade. SCS is actively monitoring and engaging on the following key issues:
Rebound from Covid-19
The air transport industry has largely rebounded from the disruptions caused by the Covid-19 pandemic, which temporarily halted international passenger flights and disrupted air cargo operations, including due to the loss of cargo capacity on passenger aircraft. In 2024, international markets largely returned to pre-Covid traffic levels, with some outliers. However, as the industry rebounds, it must also address the evolving demands of passenger travel and cargo operations. Investments in airport infrastructure, particularly for cargo handling, are essential to meet these demands. Market trends such as the e-commerce boom and regional growth in Asia and Africa highlight the need for expanded infrastructure, especially in the handling of perishables, pharmaceuticals, and other time-sensitive goods.
SCS’s participation in international aviation negotiations helps to support U.S. airlines in a post-Covid market. We are working to negotiate with new and existing partners to reach fully liberalized air service agreements, aiming to secure access to strategic airports and ensure alignment with Open Skies policies to meet demand. Additionally, we focus on global airport development projects to understand their impact on U.S. air transport service providers and promote opportunities for U.S. service providers. This includes infrastructure for special handling, such as cold storage and e-commerce distribution facilities.
Global Trade Disruptions
Over the past several years, air transport has experienced disruptions from geopolitical events like the closure of Russian airspace to U.S. operators and severe weather. Disruptions can have significant impacts on air cargo, causing delays, placing limitations on carriers’ ability to operate on specific routes, and altering demand due to shifts in transportation mode. For example, SCS is tracking how disruptions in maritime shipping, such as those in the Red Sea and Panama Canal, are influencing the demand for air cargo among shippers.
SCS also analyzes domestic disruptions impacting air transport services. For example, we have been working to assess the potential air cargo impacts of labor disputes, including recent pilot strikes and the labor negotiations involving dockworkers at East and Gulf Coast ports. Additionally, we examine the impact of weather-related disruptions, such as Hurricanes Helene and Milton in fall 2024, and how air cargo is used when other transportation modes face obstacles. Understanding these dynamics is essential for developing strategies to mitigate risks and enhance the resilience of air transport services in the face of challenges.
Incorporation of New Technologies
New technologies are driving improvements in efficiency. Data analytics and artificial intelligence are being used to optimize flight routes and fuel efficiency, while automation and advanced systems at airports enhance passenger experience and improve operations. In the cargo sector, innovations like blockchain, Internet of Things (IoT) sensors, and GPS tracking are being implemented to improve transparency, security, and customs processes.
SCS works to support the adoption of new policies and technologies, while also supporting industry in navigating new regulatory requirements and ensuring U.S. industry’s continued competitiveness as the air transport sector grows and innovates.
For more information on U.S. Open Skies policy visit Civil Air Transport Agreements – United States Department of State.
For data resources on airlines, airports, and aviation visit TranStats – Bureau of Transportation Statistics.
For data on international air travel visit the National Travel and Tourism Office International Air Passenger Monitor.
Looking for ITA’s aerospace manufacturing team? Aerospace & Defense Industry