
Research and Development
Research and Development
Overview
The Research and Development (R&D) sector includes the activities that companies undertake to innovate and introduce new products and services.
In 2017 (latest data available), the total of R&D performed in the United States was $547.9 billion, up 11 percent from $493.7 billion in 2015. This was primarily due to the sizable annual increases in business R&D investment.
- In 2017 (latest data available), U.S. businesses continued to be the predominant performer (73 percent) and funders (70 percent) of R&D in the United States.
- Higher education institutions (13 percent) and the federal government (10 percent) were the second and third largest performers of R&D in the United States in 2017 (latest data available). However, both have experienced some erosion in their shares since 2010.
Global Expenditures
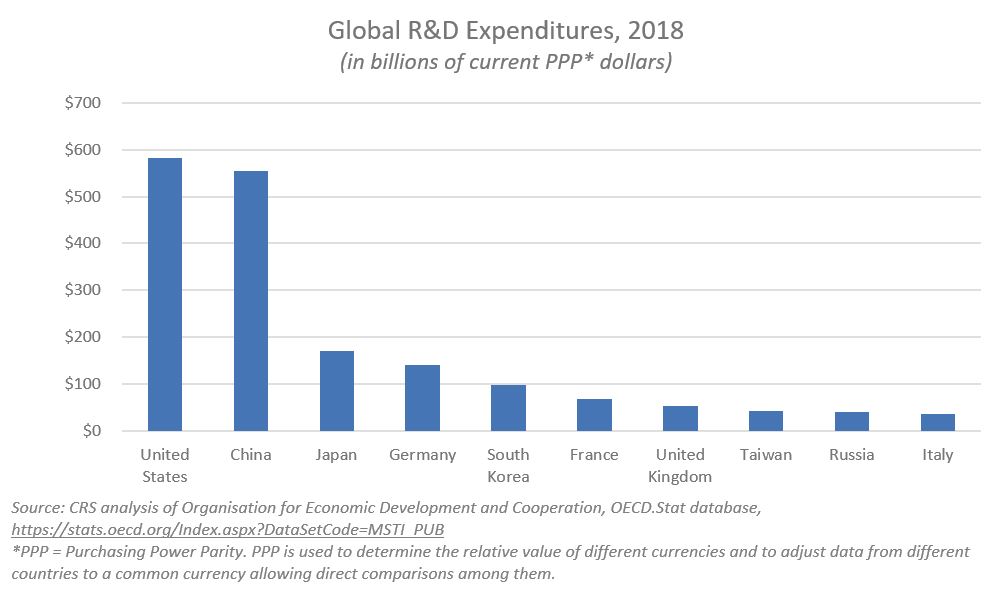
In 2018 (the most recent year for which comprehensive data is available), global R&D expenditures totaled $2.107 trillion. The United States continued to fund more R&D than any other country. China, ranked second in 2018, funded more R&D than the next four countries – Japan, Germany, South Korea, and France – combined.
Trends
For 2020 R&D World forecasts growth in global R&D investment of more than $2.4 trillion, an increase of 2.7 percent, or $64 billion, over what was invested in 2019.
The United States spent more on R&D than did any other country in 2017. However, its global share of R&D spending since 2000 has fallen as R&D spending rose in many Asian countries, especially China. In R&D intensity (ratio of R&D to gross domestic product [GDP]), the United States ranked 10th in 2017. The R&D-intensity level has risen modestly in the United States since 2000, while China and South Korea have seen rapid increases.
The United States continues to be the world’s top R&D performer. However, China is closing the gap, with an average annual growth rate that is nearly three times higher than that of the United States.
If currently spending trends continue, China is forecast to surpass the United States in R&D spending by 2025.
The global concentration of R&D performance continues to shift from the United States and Europe to South Asia and the East-Southeast Asia.
The United States, China, Japan, Germany, India, and South Korea were responsible for about 70 percent of all global R&D investments. In 2019, the United States and China invested nearly half of all global R&D monies.
Asia is currently the largest R&D investment region in the world, with more than 44 percent of the R&D share. Asia is gaining about a one-half percentage point of the global share each year and, at this rate, could account for more than half of all R&D investments by 2030.
Countries in South America and Africa continue to languish in their R&D investments. All of South America and Africa combined are only responsible for 5 percent of the total global R&D spending.
Trade in R&D
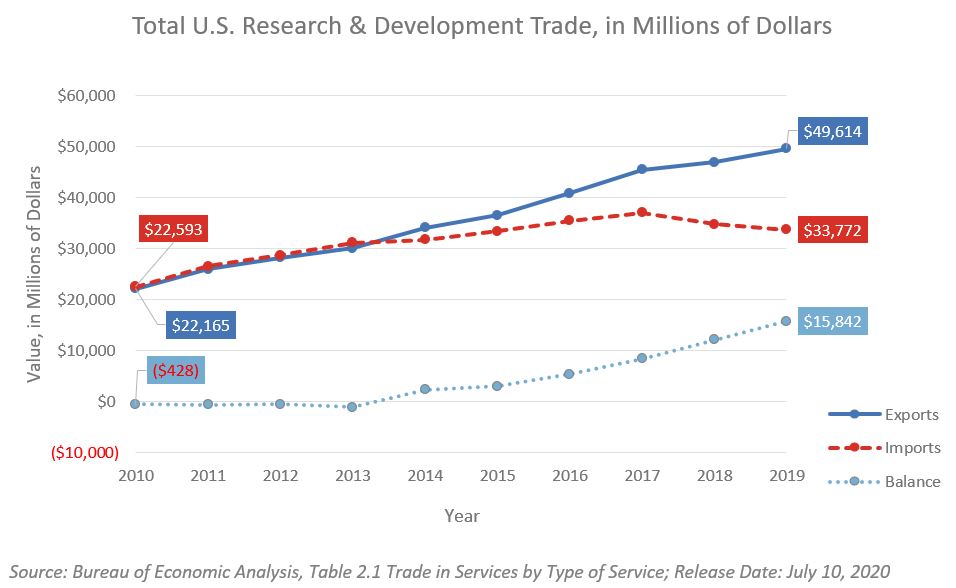
U.S. exports of R&D reached $49.6 billion in 2019, along with $33.7 billion in imports, leaving a trade surplus of $15.9 billion for the sector.
The bulk of the United States’ trade in R&D is trade between U.S. parent groups and their foreign affiliates and trade between U.S. affiliates and their foreign parent groups.
Trade between U.S. Parent Groups and their Affiliates and Trade Between U.S. Affiliates and their Foreign Parent Groups (in U.S. Dollars)
| U.S. Exports of R&D | U.S. Imports of R&D | Trade Balance | |
| World | $49.6 billion | $33.7 billion | $15.9 billion |
| U.S. Parent Groups’ Trade with their Foreign Affiliates | $30.1 billion | $25.5 billion | $4.6 billion |
| U.S. Affiliates’ Trade with their Foreign Parent Groups | $14.6 billion | $2.4 billion | $12.3 billion |
Top Export Markets for R&D
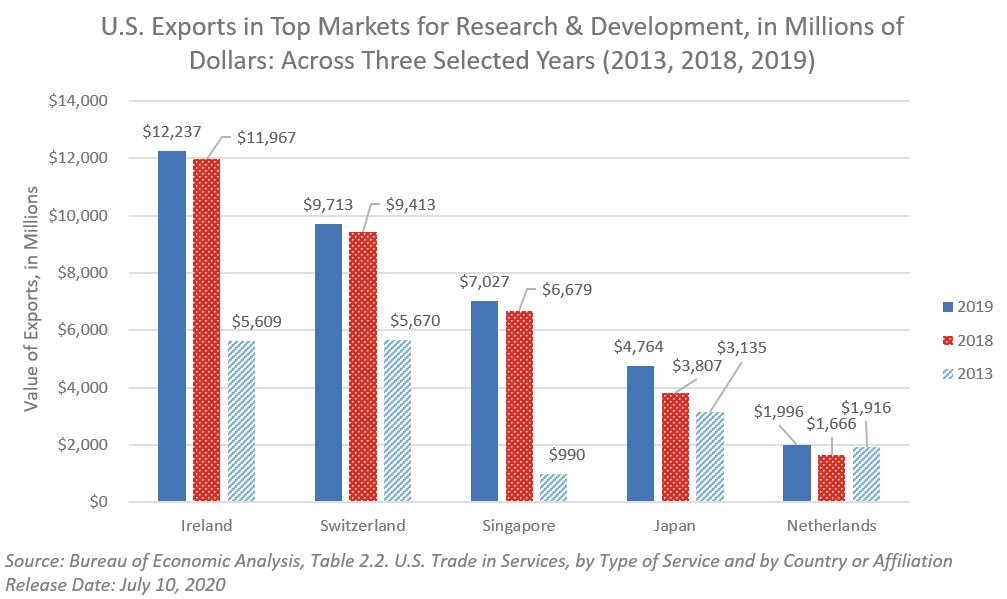
The top five markets for U.S. R&D have been pretty consistent over the past decade, with the majority of the U.S. R&D exports going to European and Asian markets.

Since about 2014-15, Ireland has been the United States’ leading trade partner in this sector. In 2019, the United States exported $12.2 billion in R&D to Ireland and imported $3.7 billion, resulting in a trade balance with Ireland of about $7.1 billion.
Other leading export markets for U.S. R&D in 2019 included Switzerland (with U.S. exports of $9.4 billion), Singapore ($6.6 billion), Japan ($3.8 billion), and the Netherlands ($1.6 billion).
Top U.S. Suppliers
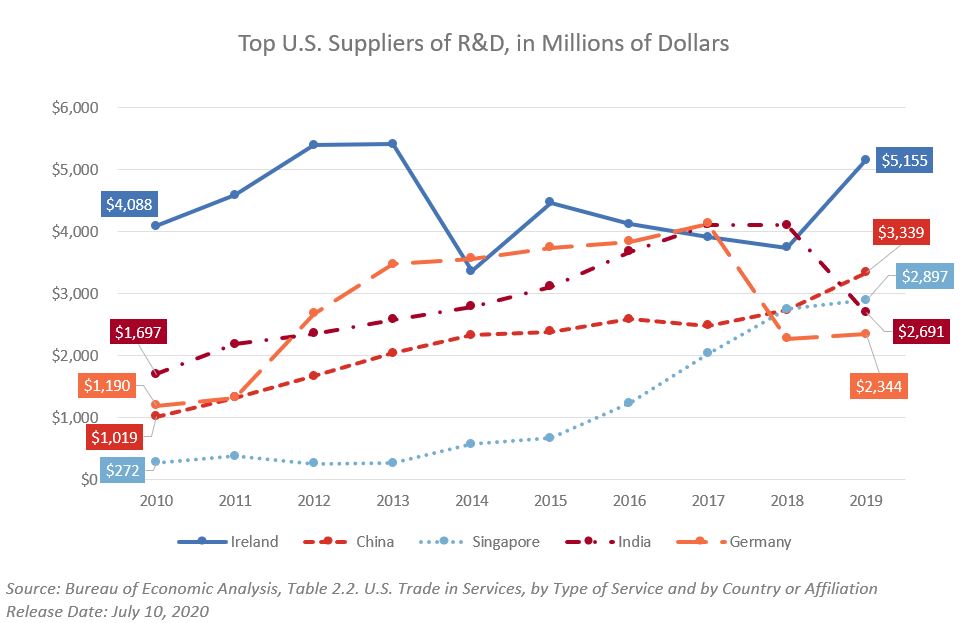
Ireland is the top supplier of R&D to the United States. The United States imported $5.1 billion in R&D from Ireland in 2019. China ($3.3 billion), Singapore ($2.9 billion), India ($2.7 billion), and Germany ($2.3 billion) round out the top five suppliers of R&D to the United States in 2019.
Click here to access the full data for all of these charts.
Access more information on ITA’s work on research and development here.
Return to the Professional and Business Services page here.
Return to the Education and Training Services page here.
ITA Resources
Rachel Alarid
Education Services
Rachel.Alarid@trade.gov
202.482.5154