F-35
Aerospace & Defense
Our industry experts are dedicated to enhancing the global competitiveness of the U.S. aerospace and defense industry, expanding market access, and increasing exports. The Aerospace Team uses our presence in 200 global cities to help foster new business relationships and expand the world-wide presence of U.S. firms.
Satellite
Aerospace & Defense
Our industry experts are dedicated to enhancing the global competitiveness of the U.S. aerospace and defense industry, expanding market access, and increasing exports. The Aerospace Team uses our presence in 200 global cities to help foster new business relationships and expand the world-wide presence of U.S. firms.
Engine
Aerospace & Defense
Our industry experts are dedicated to enhancing the global competitiveness of the U.S. aerospace and defense industry, expanding market access, and increasing exports. The Aerospace Team uses our presence in 200 global cities to help foster new business relationships and expand the world-wide presence of U.S. firms.

Leading Economic Indicators Aerospace Industry

Overview

The U.S. aerospace sector continues to produce the highest trade balance ($77.6 billion in 2019) and the second highest level of exports ($148 billion) among all manufacturing industries.  This predominant position has remained unchanged for decades, with aerospace exports having grown at an average rate of 5.31 percent over the last 10 years and the aerospace trade balance increasing at an average rate of 4.64 percent since 2010.  

A line chart showing aerospace trade from 2010-2019
Source: U.S. Department of Commerce, Bureau of the Census, Foreign Trade Division

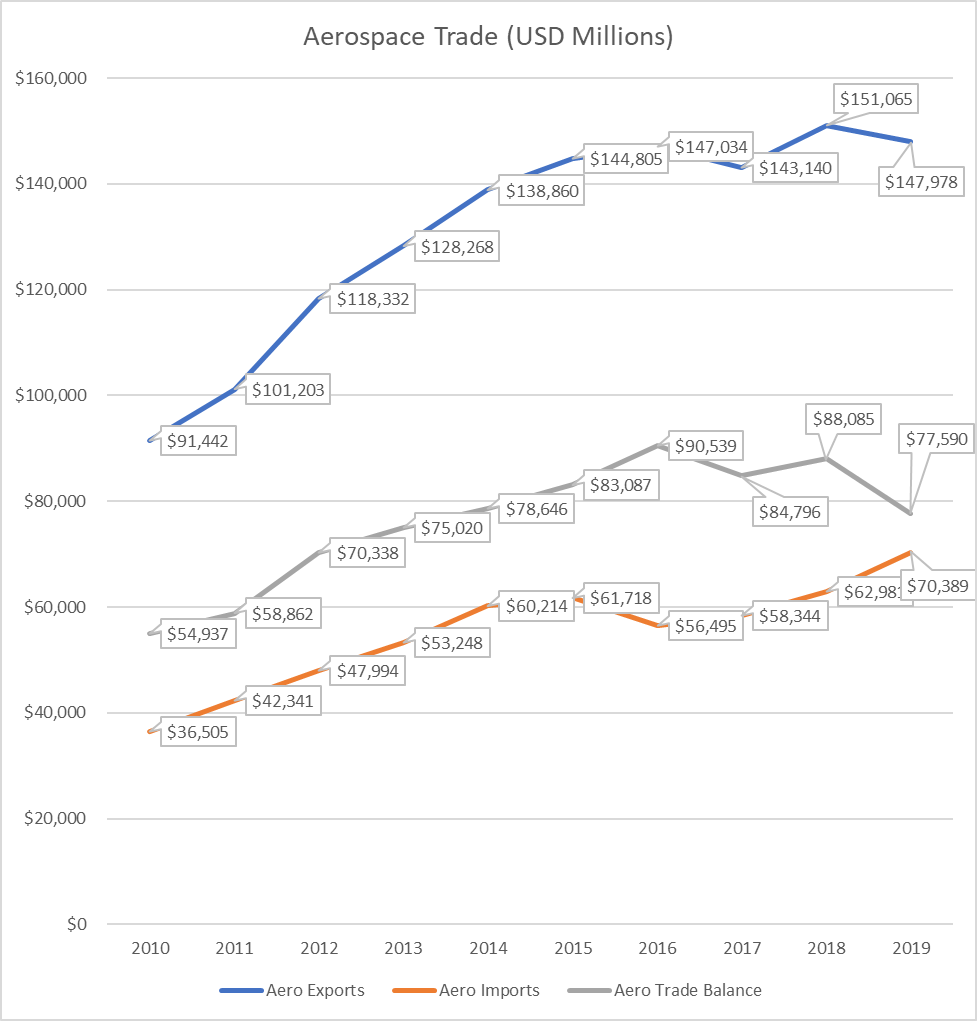
        *To view the data in this chart in table form, view this page.

The top five export markets for U.S. aerospace products have been remarkably similar over the last 10 years, with China being the top market from 2012 to 2018, France as the top destination in 2010 and 2019, and the United Kingdom claiming that spot in 2011.  Canada as well has been a top 5 market for U.S. aerospace products over the last decade (except in 2012), though they never have been the number 1 market.  The other spots in the top 5 vacillated between Japan and Germany, with the United Arab Emirates making an appearance in the top 5 in 2012.


The top five aerospace suppliers to the U.S. have been much more consistent over the past decade, with France being the top supplier and Canada the second largest supplier since 2010.  Japan was the third largest supplier this decade for all years except 2010 (when the United Kingdom took that spot).  The fourth and fifth positions among the top five suppliers since 2010 were either Germany or the UK (again, except for 2010).


Taking a look at total shipments of U.S. aircraft and parts (M3 data), nondefense shipments rose from 2010 to 2018 before dipping (from $162 billion to $128 billion) in 2019.  This trend resulted in an average growth rate of 5.21 percent since 2010.  Defense aircraft and parts shipments remained relatively steady over the past decade with some decline (granting an average growth rate of -1.6 percent since 2010.  For all aircraft and parts shipments, the average growth rate was about 3.03 percent since 2010.

A line chart showing aerospace parts and shipments by value from 2010-2019
Source: U.S. Department of Commerce, Bureau of the Census, Manufacturing and Construction Division

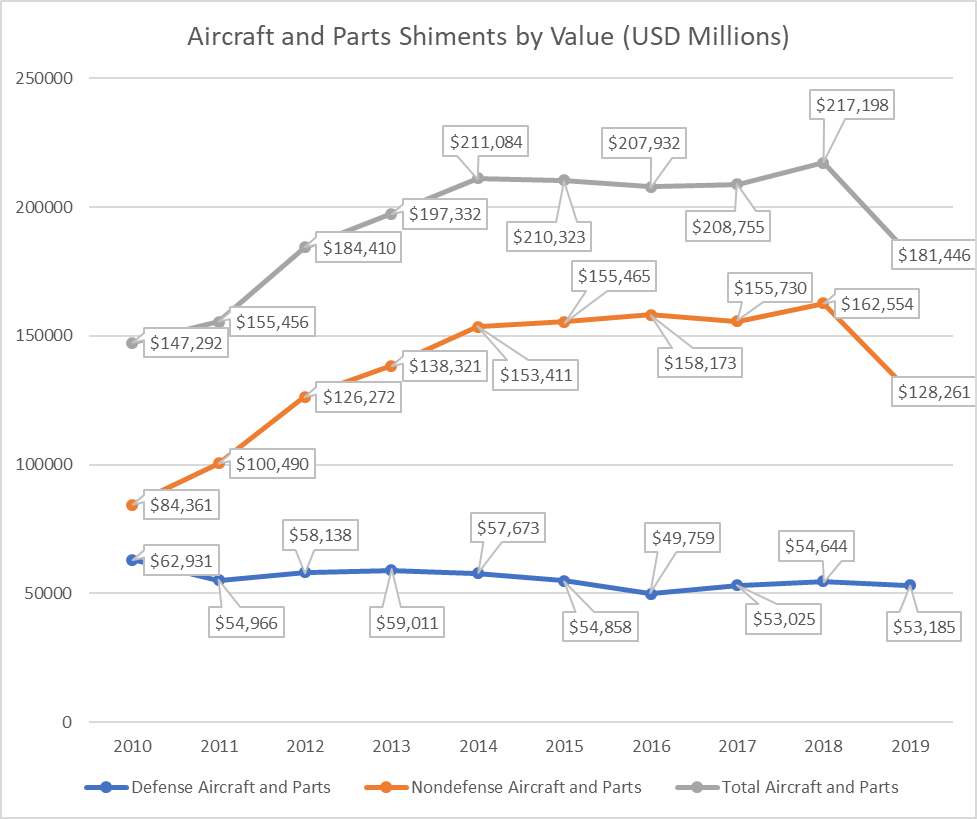
         *To view the data from this chart in table form, view this page.

Since 2010, the percentage of nondefense aircraft and parts has increased vis-à-vis defense aircraft and parts for all years except 2017 and 2019.

Bar chart showing Aerospace parts and shipments by percentage from 2010-2019
Source: U.S. Department of Commerce, Bureau of the Census, Manufacturing and Construction Division

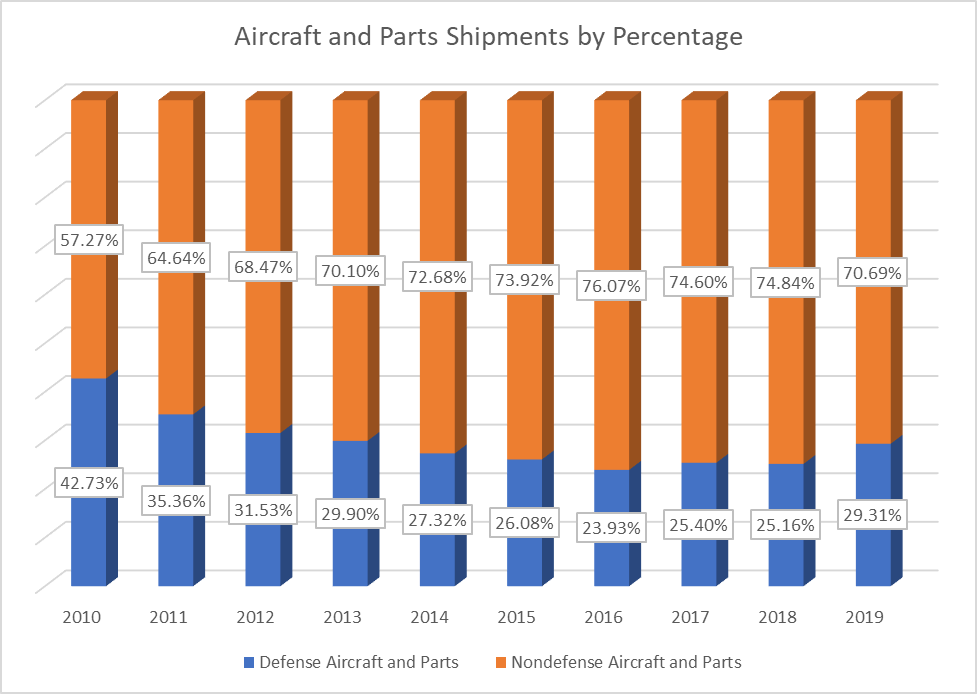
       *To View the data in this chart in table form, view this page.


Employment in the U.S. aerospace industry has been relatively consistent over the past 10 years, with direct employment ranging from 477,700 employees in 2010 to a high of 534,3000 employees in 2019 and growth averaging out at approximately 0.72 percent.  Looking at production and nonsupervisory employees alone, that consistency is even more pronounced with an average growth rate of 0.08 percent, a low of 271,500 employees in 2014, and a high of 300,300 employees in 2019.
 

×

Global Business Navigator Chatbot Beta

Welcome to the Global Business Navigator, an artificial intelligence (AI) Chatbot from the International Trade Administration (ITA). This tool, currently in beta version testing, is designed to provide general information on the exporting process and the resources available to assist new and experienced U.S. exporters. The Chatbot, developed using Microsoft’s Azure AI services, is trained on ITA’s export-related content and aims to quickly get users the information they need. The Chatbot is intended to make the benefits of exporting more accessible by understanding non-expert language, idiomatic expressions, and foreign languages.

Limitations

As a beta product, the Chatbot is currently being tested and its responses may occasionally produce inaccurate or incomplete information. The Chatbot is trained to decline out of scope or inappropriate requests. The Chatbot’s knowledge is limited to the public information on the Export Solutions web pages of Trade.gov, which covers a wide range of topics on exporting. While it cannot provide responses specific to a company’s product or a specific foreign market, its reference pages will guide you to other relevant government resources and market research. Always double-check the Chatbot’s responses using the provided references or by visiting the Export Solutions web pages on Trade.gov. Do not use its responses as legal or professional advice. Inaccurate advice from the Chatbot would not be a defense to violating any export rules or regulations.

Privacy

The Chatbot does not collect information about users and does not use the contents of users’ chat history to learn new information. All feedback is anonymous. Please do not enter personally identifiable information (PII), sensitive, or proprietary information into the Chatbot. Your conversations will not be connected to other interactions or accounts with ITA. Conversations with the Chatbot may be reviewed to help ITA improve the tool and address harmful, illegal, or otherwise inappropriate questions.

Translation

The Chatbot supports a wide range of languages. Because the Chatbot is trained in English and responses are translated, you should verify the translation. For example, the Chatbot may have difficulty with acronyms, abbreviations, and nuances in a language other than English.

Privacy Program | Information Quality Guidelines | Accessibility