
National Trade Data
National Trade Data Tools
Build your own data report. Select the time period, product, and country/region of interest to generate visuals and download the resulting data.
Infographics and Tables
Monthly Trade Infographic
Easy to read visualizations on the latest monthly and year-to-date statistics on U.S. goods and services trade.
Partner Trade Tables (Year-to-Date)
Interactive tables showing the latest monthly export and import figures and rankings for U.S. goods trade partners.
Annual Trade Infographic (2024)
Easy to read visualizations on the latest annual statistics on U.S. goods and services trade.
Annual Partner Trade Tables (2024)
Interactive tables showing the latest full year of export and import figures and rankings for U.S. goods trade partners.
Explore ITA’s Other Data Sources
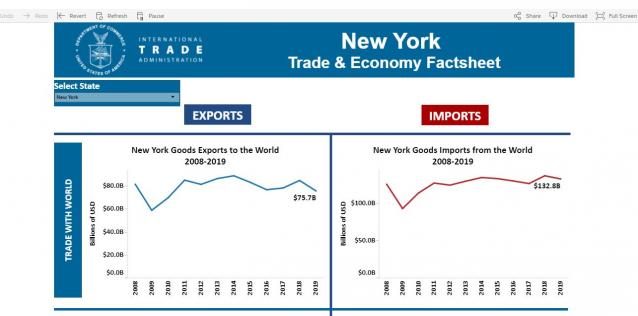
State Trade Data
Interactive factsheets and databases displaying exports, imports, and other trade-related statistics.

Metropolitan Export Series
Interactive tools and factsheets showing good exports from more than 380 U.S. metropolitan statistical areas (MSAs).
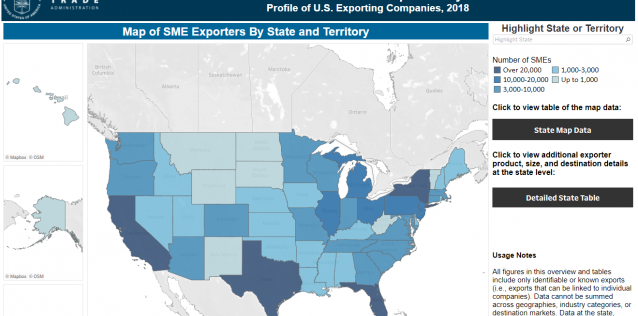
ITA Exporter Database
Data on U.S. goods exporters, including their size, locations, products, and markets.
Trade and Analysis Home Page
Get the latest data and reports produced by ITA's team of trade specialists.