Q3 2023 SIAT Inbound Results
NTTO Publishes Q3 2023 Survey of International Air Travelers (SIAT) Inbound Results
- Average Overseas visitor spent $1,863 per trip in the United States
- Average Mexican visitor spent $1,514 per trip in the United States
- Average Canadian visitor spent $999 per trip in the United States
The International Trade Administration’s National Travel and Tourism Office (NTTO) released the results of the inbound Survey of International Air Travelers (SIAT) covering the third quarter of 2023. The Inbound SIAT measures the characteristics of international inbound air travelers who visited the United States.
International Inbound Air Travelers To the United States in the Third Quarter 2023
- Overall (Overseas, Canada, and Mexico) international air travelers spent $20.9 billion in the United States in the third quarter of 2023, up 19.9% from the third quarter of 2022.
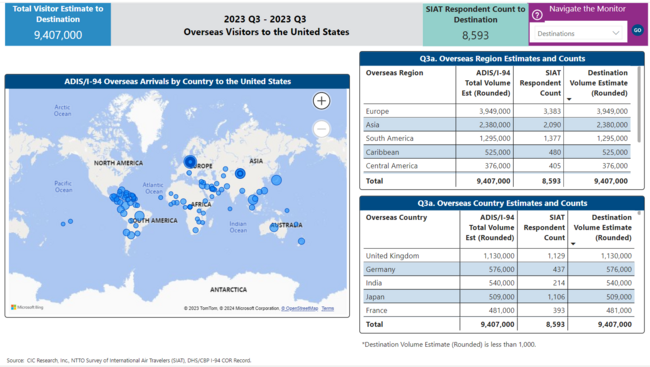
- Top-line characteristics of the 9.4 million Overseas visitor arrivals to the United States:
- The average overseas visitor had a combined annual household income of $91,579, stayed 17.39 nights and spent $1,863 while in the United States. Estimated overall travel spending in the United States was $17.5 billion, up 20.0% from the third quarter of 2022.
- The United Kingdom (1,130,000 visitor arrivals) was the top source market, followed by Germany (576K), India (540K), Japan (509K) and France (481K).
- New York (2,151,000) was the top state visited, followed by California (1.9M), Florida (1.6M), Nevada (679K), and Hawaii (581K).
- The average overseas visitor made decision to visit the United States 109.2 days prior to trip and made an airline reservation 78.8 days prior to trip.
- 57.4% traveled alone, 21.8% traveled with family/relatives, and 20.2% traveled with a spouse/partner.
- Vacation/Holiday was the top main purpose of the trip (59.2%), followed by Visit Friends/Relatives (22.9%), and Business1 (13.7%).
- Shopping was the top (83.0%) leisure activity engaged, followed by Sightseeing (79.6%), National Parks/Monuments (39.7%), Small Towns/Countryside (34.2%), and Art Galleries/Museums (31%).
- Hotel or Motel, etc. was the top (71.2%) type of accommodation used, while Auto (Private or Company) was the top (38.2%) type of transportation used in the United States.
- Top-line characteristics of the 2.1 million Canadian-air visitor arrivals to the United States:
- The average Canadian-air visitor had a combined annual household income of $122,769, stayed 7.67 nights and spent $999 while in the United States.
- Estimated overall travel spending in the United States was $2.1 billion, up 4.2% from the third quarter of 2022.
- California (451,000) was the top state visited, followed by Florida (399K), New York, (338K), Nevada (284K), and Texas (111K).
- The average Canadian visitor made decision to visit the United States 80.9 days prior to trip and made an airline reservation 59.9 days prior to trip.
- 60.5% traveled alone, 21.3% traveled with a spouse/partner, and 17.9% traveled with family/relatives.
Vacation/Holiday was the top main purpose of the trip (58.4%), followed Visit Friends/Relatives (23.1%) and Business (16.4%). - Shopping was the top (74%) leisure activity engaged, followed by Sightseeing (73.1%), Experience Fine Dining (30.7%), Art Galleries/Museums (21.7%), and Amusement/Theme Parks (20.9%).
- Hotel or Motel, etc. was the top (76.6%) type of accommodation used, while Ride-sharing Service was the top (38.9%) type of transportation used in the United States.
- Top-line characteristics of the 844,000 Mexican-air visitor arrivals to the United States:
- The average Mexican visitor had a combined annual household income of $61,175, stayed 12.87 nights and spent $1,541 while in the United States. Estimated overall travel spending in the United States was $1.3 billion, up 58.5% from the third quarter of 2022.
- Texas (171,000) was the top state visited, followed by California (167K), Florida (145K), New York (101K), and Nevada (76K).
- The average visitor made decision to visit the United States 64.4 days prior to trip and made an airline reservation 42.1 days prior to trip.
- 67.6% traveled alone, 19.9% traveled with family/relatives, and 1.23% traveled with a spouse/partner.
- Vacation/Holiday was the top main purpose of the trip (56.0%), followed by Visit Friends/Relatives (21.7%), and Business1 (19.1%).
- Shopping was the top (83.4%) leisure activity engaged, followed by Sightseeing (68.7%), Amusement/Theme Parks (33.3%), National Parks/Monuments (28.5%), and Art Galleries/Museums (27.3%).
- Hotel or Motel, etc. was the top (62.8%) type of accommodation used, while Auto (Private or Company) was the top (47.7%) type of transportation used in the United States.
How to Access Q3 Inbound SIAT Statistics
- The SIAT Inbound Survey Monitor is an interactive tool to analyze the characteristics of international inbound air visitors at the country or world region level on an annual or quarterly basis from 2012 to present. The Monitor is also capable of calculating current year-to-date (YTD) estimates, for example 3Q2023 YTD (which includes 4Q2022+1Q2023+2Q2023+3Q2023)
- The Survey of International Air Travelers Results - Inbound Report includes quarterly and annual SIAT results for:
- Overseas: containing 4 Banners each containing 40 tables: Banner 1 (Total Overseas), Banner 2 (European Countries/Regions), Banner 3 (Asian Countries/Regions), and Banner 4 (Latin Countries/Regions.
- Canada: containing 1 Banner with containing 40 tables
- Mexico: containing 1 Banner with containing 40 tables
- The Survey of International Air Travelers Results - Inbound Report includes quarterly and annual SIAT results for: